Overview
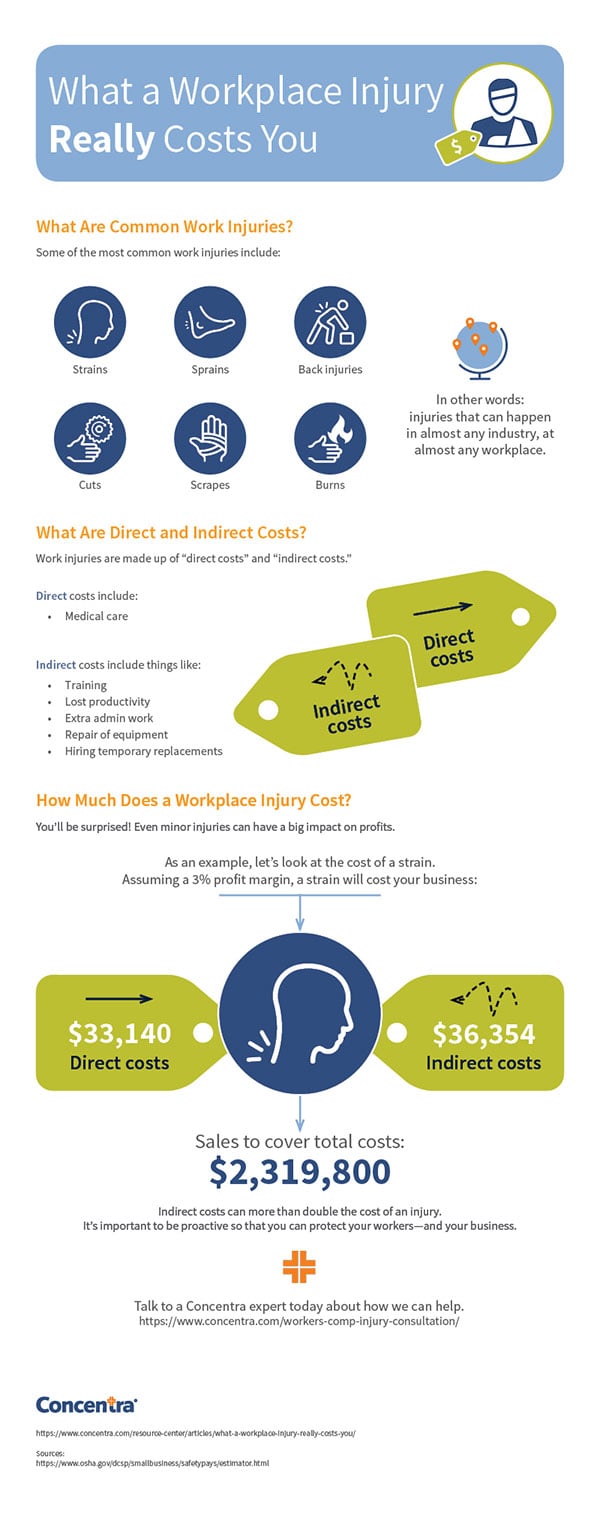
A three-part graphic titled, “What a Workplace Injury Really Costs You.”
Details/values
The first section of the graphic begins with the headline, “What are Common Workplace Injuries?” and gives six examples of the most common work-related injuries, which are:
- Strains
- Sprains
- Back injuries
- Cuts
- Scrapes
- Burns
A featured note clarifies that workplace injuries can happen “in almost any industry, at almost any workplace.”
The second of three sections features the headline, “What are Direct and Indirect Costs?” with a sub-heading explaining that “Work injuries are made up of direct and indirect costs.” Direct costs are listed as:
Indirect costs are listed as:
- Training
- Lost productivity
- Extra admin work
- Repair of equipment
- Hiring temporary replacements
The third section begins with the headline, “How Much Does a Workplace Injury Cost?” with a sub-heading exclaiming, “You’ll be surprised! Even minor injuries can have a big impact on profits.” An example is provided in the form of a visual graphic illustrating the direct and indirect costs of a strain, assuming a company operates with a 3% margin. These are estimated at:
- Direct costs of a strain: $33,140
- Indirect costs of a strain: $36,354
- Total sales to cover the cost of the injury: $2,319,800
A final statement reads, “Indirect costs can more than double the cost of an injury. It’s important to be proactive so you can protect your workers – and your business.”
At the bottom of the graphic is the Concentra’s orange cross logo and the following link to speak with a Concentra expert: www.concentra.com/workers-comp-injury-consultation
Presentation
The graphic is presented as a single vertical image with three primary sections “stacked” on top of one another. The first section features common workplace injuries shown as line-drawing icons in white contained within blue circles. The second section defining direct and indirect costs of an injury features green tag shapes with a dashed, curved line to reflect indirect costs and a straight, solid line to reflect direct costs. The final section illustrating the estimated cost of a strain injury reuses the same line-drawn icon in a blue circle that is shown for “strain” in the first section. On either side of the icon are the green tags reflecting direct and indirect costs and the solid and dashed arrows mentioned above. Overall, bolded statements are shown in orange and blue, while the remainder of the text is shown in black.


